

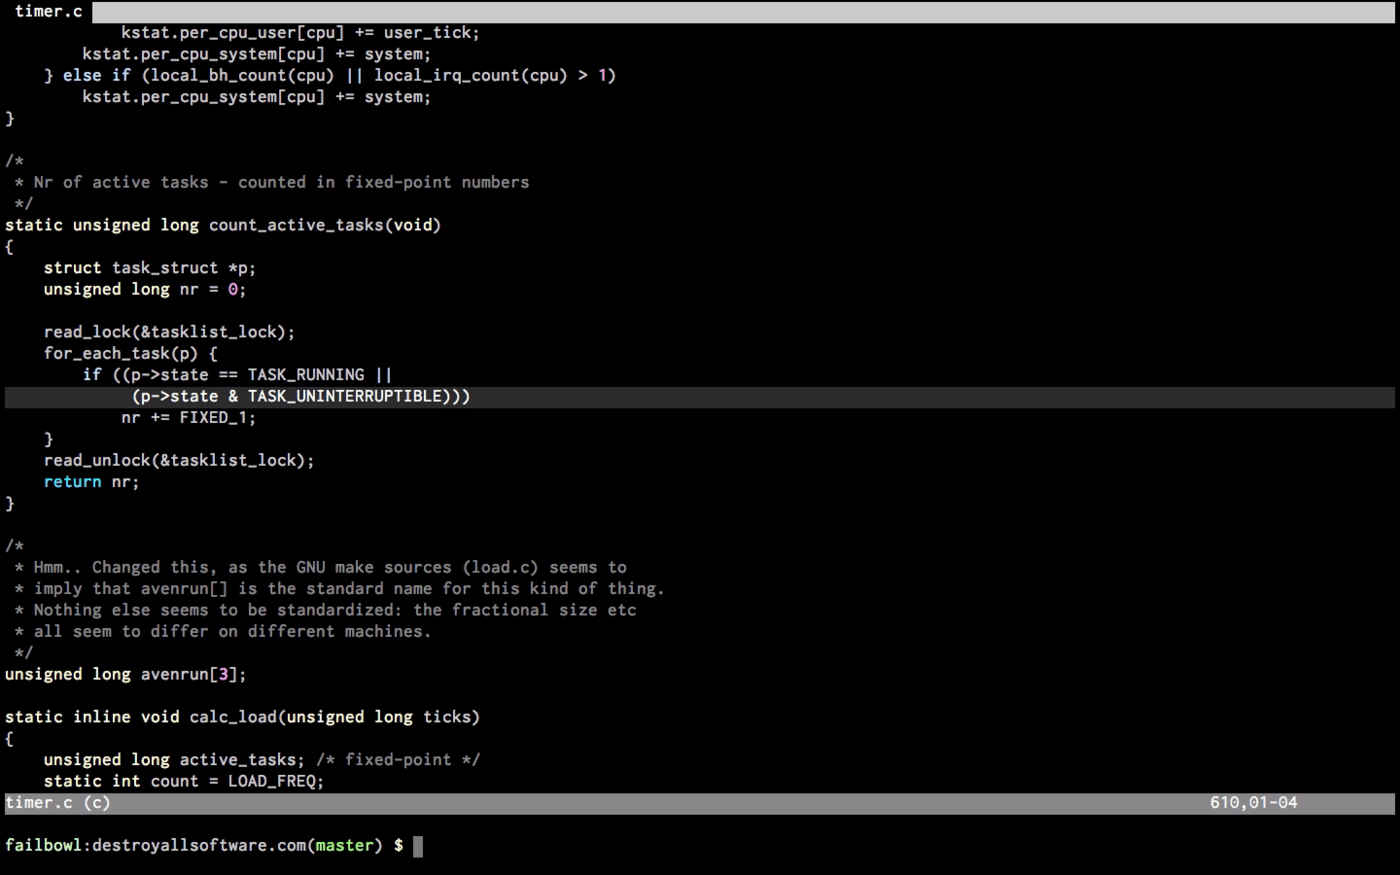
When analyzing a system's behavior or performance, there's a huge spectrum of tools available: everything from the load average—which boils a machine down to a single number—to DTrace and STrace, which can provide very fine-grained information. We'll briefly look at the load average and why it's not sufficient. Then we'll look at one particular method that's in between the two extremes: the /usr/bin/time command, which can report many statistics about program execution. We'll use it to compute the number of involuntary context switches in each of Destroy All Software's Cucumber scenarios, giving us a starting point for localizing an anomaly in the system's behavior.
Note: Some questions have been raised about the exact details of load average accounting. Unfortunately, I'm not an expert on Linux kernel internals, so I'm going to resist the urge to try to correct myself. To be brief: I may have significantly overstated the impact of IO on load average accounting. In any case, the larger point is unaffected: load average is at one extreme of the continuum of performance analysis tools and, once you get past the first few seconds of performance analysis, you'll need to dig deeper.
Execute Program
Looking for something more interactive? Try Execute Program, an interactive learning platform from Destroy All Software LLC! It has courses on TypeScript, SQL, regular expressions, JavaScript concurrency, and more. All Destroy All Software subscriptions include full access to Execute Program, or you can subscribe to Execute Program directly.